Part I
Part I is dedicated to determining the nature of a statement made by a news organization, and also to use the information provided to determine the crime rate given the percent of free lunches for an area.
A local news organization went on the record saying that as the number of kids that get free lunches increases, so does the crime in an area. The data the news organization used in this claim was used to see how much water this statement holds. A regression analysis is run to determine the significance of the relationship between these two variables (Figure 1, and Figure 2). The results of these tests are below. The results from Figure 2 were then used to determine what the corresponding crime rate per 100,000 people would be given a 23.5% free lunch for an area.
 |
| Figure 1: R squared regression results. |
 |
| Figure 2: Regression results for free lunch and crime percentage. |
Y = a + bx
Y= Crime rate
a = Constant
b = PercentFreeLunch B Coefficient
x = Percent Free Lunch For an area
Crime Rate = 21.819 + 1.685(23.5)
=61.4165 per 100,000 people
Due to the results of the regression, the news outlet can make a claim that there as the number of children with free lunches increases, so does the crime, however, this is a very shakey claim. The significance value of the results is p=.05, and the beta is .416, which means that there is barely a positive linear relationship between the two variables. On top of this, the r squared results is .173, which means that the Crime Rate only explains 17.3% of the number of free lunches distributed. This low of a number indicates that the model is very poor at explaining the variance of percent free lunches. These factors put together make it a very poor choice to indicate that as the percent of free lunches increases, so does the crime rate.
Part II
Key words for Part II:
Regression Analysis: A statistical tool used to investigate the relationship between two variables
Dependent Variable: What is explained by the other variables
Independent Variables: The variables which are used to analyze the dependent variable
Linear Relationship: Significant relationship exists between independent and dependent variables
R-Squared: Or coefficient of determination, is a number which represents the variance of the dependent from the independents included in the model
Residual: How far the observed value is from the theoretical value
Introduction
Part II is dedicated to analyze the factors which influence 911 calls throughout Portland, Oregon. The City of Portland is interested in assessing their efficiency in responding to 911 calls. To accomplish this, they want to see what factors can help to explain where the most calls come from. A company is also interested in building a new hospital, and this report will help to use the factors listed below to determine potential locations for building an ER.
The factors are:
911 Calls (Dependent Variable)
Jobs
Renters
Low Education (People with no high school degree)
Alcohol Sales (AlcoholX)
Unemployed
Foreign Born population
Median Income
College Grads
The factors are:
911 Calls (Dependent Variable)
Jobs
Renters
Low Education (People with no high school degree)
Alcohol Sales (AlcoholX)
Unemployed
Foreign Born population
Median Income
College Grads
Methods
To determine results, the first step is to use regression analysis on a variety of variables to try to find significant linear relationships between the independent variables and 911 calls. The three variables chosen were jobs, renters, and low education. This was due to a quick stepwise regression analysis to determine if there were three significant variables that were the result of that. The stepwise process is described later on in this report. Figures 1, 2, and 3 describe the results of this below.
The next step is to make two maps, one being a cholopleth map of the number of calls per census tract, and the other being a standardized residual map of the renters per census tract in Portland. The renters was the variable chosen because it has the highest r-squared value out of the three variables analyzed. The residual map is created in ArcMap using the Ordinary Least Squares (OLS) tool to create a shapefile of the renter residuals.
The third step of the report is to use a multiple regression report. This process uses all of the independent variables listed above. Collinearity Diagnostics are ran along with the multiple regression report to determine if there is multicollinearity present among the independent variables. After this is completed, a stepwise approach to help determine which variable is the most important. A final map is created using the three variables from the stepwise results in ArcMap with the OLS process.
Results
Figure 1 below displays the results of running a linear regression report using jobs as the independent variable against 911 calls as the dependent. Jobs displays a positive linear relationship with 911 calls. The p value is less than .05, and the beta is a .583 which is the basis of the claim. The r-squared is .34 which means that 34% of the 911 calls can be explained by jobs per census tract.
 |
| Figure 1: Regression results from jobs against 911 calls. |
Figure 2 below displays the results of running a linear regression report using low education as the independent variable against 911 calls as the dependent. Low education displays a positive linear relationship with 911 calls. The p value is less than .05, and the beta is a .753 which is the basis of the claim. The r-squared is .567 which means that 56.7% of the 911 calls can be explained by jobs per census tract. This is higher than the amount of 911 calls explained by jobs per census tract.
 |
| Figure 2: Regression results from running low education against 911 calls. |
Figure 3 below displays the results of running a linear regression report using renters per census tract as the independent variable against 911 calls as the dependent. Renters displays a positive linear relationship with 911 calls. The p value is less than .05, and the beta is a .785 which is the basis of the claim. The r-squared is .616 which means that 61.6% of the 911 calls can be explained by renters per census tract. This is higher than the amount of 911 calls explained by jobs per census tract, and low education. Renters per census tract displayed the highest r-squared value out of the three values ran in regression models against the dependent of 911 calls. This result helped to create a residual map of renters in Figure 5 below.
 |
| Figure 3: Regression results from running renters against 911 calls. |
Figure 4 displays results of creating a chloropleth map out of 911 calls within Portland. This process creates a ranked order of census tracts comparing direct amounts of 911 calls throughout the city. The results help one see the tracts within the north central portion of the city receive the largest amount of 911 calls per tract. Using just this map, the small tract displaying 19-56 911 calls between 4 of the highest proportion could be the new location for the hospital.
 |
| Figure 4: Chloropleth map results of 911 calls throughout the census tracts of Portland, OR. |
Figure 5 below displays a standardized view of the residuals of census tracts based on renters within the city. The darker the red displays the higher the proportion of renters making 911 calls, the darker the blue displays the lower proportion of renters making 911 calls.
 |
| Figure 5: Standard deviation map of residuals for renters in in Portland, OR against 911 calls. |
Figure 6 below displays the results of running a multiple regression report with all of the variables along with a collinearity report to determine if there are any independent variables which are related and thus change the results of the multiple regression report. Using all of the variables, only jobs and low education display a linear relationship with 911 calls, and they both have positive linear relationship. Although this is true, the r-squared is .783 which means that 78.3% of the 911 calls are explained by the independent variables within the model.
Viewing the collinearity diagnostics, the condition index is less than 30, and therefore there is no multicollinearity. Although this is true, the low amount of independent variables that display a linear relationship with 911 calls suggests that the variables do tend to pull the trend line around without having too much significance on 911 calls.
 |
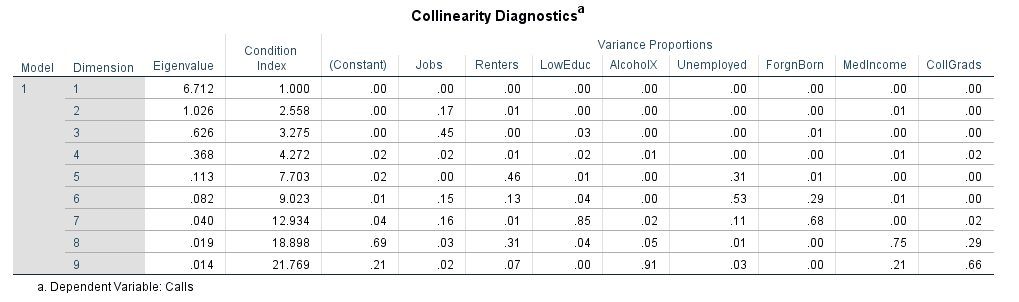 |
| Figure 6: Multiple linear regression and collinearity results using all of the independents against the dependent. |
Figure 7 displays the stepwise regression report using all of the independent variables. The three variables that were included in the report are renters, low education, and jobs. The three all display a positive linear relationship with 911 calls. The r-squared of the model with all three included is .771, which means that 77.1% of the 911 calls can be explained by these three independents together. This is only 12% smaller than the model with all of the variables included, and all three of the independents in the stepwise results all have a positive linear relationship. A spatial representation of this report is below in Figure 8.

 |
| Figure 7: Stepwise regression results from all of the variables. |
 |
| Figure 8: Standard deviation map of the residuals of the stepwise regression results. |
Conclusions
The City of Portland now knows that renters, jobs, and low education within its census tracts are the three strongest results of the models presented for explaining 911 calls. They can use this information to find how to best respond to 911 calls, and to help create community programs which can address at least jobs and low education within the city. Although multicollinearity was not present, the results suggest that the combination of all of the independent variables is too much, and can sway the r-squared in a positive direction. Assignment 6 shows that SPSS and ArcMap can create highly accurate results that give users real information to create dynamic change within cities across the country.
No comments:
Post a Comment